Summary
- The Fed officially just ended its bond buying program, marking the close of a financial era.
- With the bull market now in its 6th year, stocks may struggle to continue their run without the Fed's help.
- Many significant warning signs are signaling an oncoming bear market.
- There are smart steps you can take to better hedge your portfolio.
1) There have only been 2 longer bull markets in recent history

Beginning in January 2009, this bull market is now in its 71st month. Only two bull markets have lasted longer in the past century, during the 1920s and the 1990s.
2) Price-to-earnings ratios are approaching 2006 levels

The widely-recognized "Shiller-PE" ratio compares average inflation-adjusted earnings from the previous 10 years to the current price of the S&P 500. This helps to smooth out variance over time caused by natural fluctuations in the business cycle. The current level of the Shiller-PE of over 25 is near that of 2006 and well above the mean of 16.5. While this does not indicate an imminent collapse, history would suggest that the stock market may not be the best investment for the next ten years.
3) The Fed is removing the punch bowl
Effective Federal Funds rate

Interest rates have been at historic lows for the past five years. The Fed just stopped their bond buying program altogether. This has created a sensational environment where stocks are one of the only reasonable investment options. Moving forward, however, the market faces a cruel double-edged sword. Strong growth will prompt the Fed to begin raising rates, causing investors to demand higher returns and businesses to cut back. Weak growth will threaten corporate earnings and spark worries about another recession. Either way, stocks may fall.
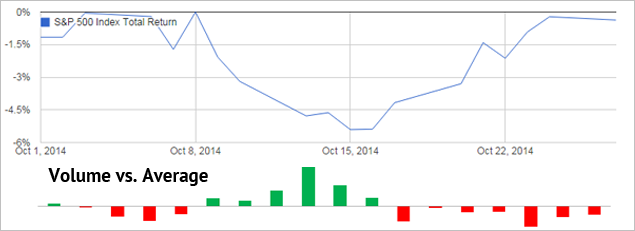
4) The worrying volume of recent rallies

October was a rollercoaster ride for the markets. While most of the losses have been offset here at month end, the gains have occurred with relatively light trading volume. This suggests that the major players aren't the ones buying.
5) Global growth is teetering
As recently studied by Larry Summers, India and China may be on the brink of a major slowdown. China has experienced a 32-year streak of extremely rapid growth, perhaps one of the longest streaks in all of history. Its economy is supported by approximately six trillion dollars of 'shadow debt', which may eventually create major systemic issues. While the US may not be the primary source of the next global slowdown, it would still certainly be a victim of the ripple effect.
How to Protect Your Portfolio
The two most likely scenarios for the economy are a rising interest rate environment with moderate growth, or a continued global slowdown which carries the risk of another recession. Unfortunately, US stocks face an uphill battle in both cases. If the Fed begins to raise rates, it will be a drag on both stocks and bonds. If rates remain low, it will probably only be due to a poor overall economic environment.
If you are seeking alternatives for your portfolio, you may want to consider a few contrarian investment options. When the Fed does raise rates, it will probably be on the heels of stronger growth and higher inflation. In that environment, Treasury-Inflation Protected Bonds (TIPS) can help keep you safe from the rising price level, and commodities like gold and oil may outperform due to a weaker dollar and stronger demand. On the other hand, if a significant slowdown occurs, investors may flee back into the safety of Treasury bonds, sending interest rates down yet again. Since it is unclear how the future will unfold, it may be wise to hedge your portfolio with some or all of these investments for the time being.
Disclosure
This information does not constitute investment advice or an offer to invest or to provide management services and is subject to correction, completion and amendment without notice. Hedgewise makes no warranties and is not responsible for your use of this information or for any errors or inaccuracies resulting from your use. Hedgewise may recommend some of the investments mentioned in this article for use in its clients' portfolios. Past performance is no indicator or guarantee of future results. Investing involves risk, including the risk of loss. All performance data shown prior to the inception of each Hedgewise framework (Risk Parity in October 2014, Momentum in November 2016) is based on a hypothetical model and there is no guarantee that such performance could have been achieved in a live portfolio, which would have been affected by material factors including market liquidity, bid-ask spreads, intraday price fluctuations, instrument availability, and interest rates. Model performance data is based on publicly available index or asset price information and all dividend or coupon payments are included and assumed to be reinvested monthly. Hedgewise products have substantially different levels of volatility and exposure to separate risk factors, such as commodity prices and the use of leverage via derivatives, compared to traditional benchmarks like the S&P 500. Any comparisons to benchmarks are provided as a generic baseline for a long-term investment portfolio and do not suggest that Hedgewise products will exhibit similar characteristics. When live client data is shown, it includes all fees, commissions, and other expenses incurred during management. Only performance figures from the earliest live client accounts available or from a composite average of all client accounts are used. Other accounts managed by Hedgewise will have performed slightly differently than the numbers shown for a variety of reasons, though all accounts are managed according to the same underlying strategy model. Hedgewise relies on sophisticated algorithms which present technological risk, including data availability, system uptime and speed, coding errors, and reliance on third party vendors.


